> For the complete documentation index, see [llms.txt](https://docs.gotempest.app/llms.txt). Markdown versions of documentation pages are available by appending `.md` to page URLs; this page is available as [Markdown](https://docs.gotempest.app/productivity/terminal-output-highlighting.md).

# Terminal Output Highlighting

Tempest can automatically color plain terminal output — errors, warnings, success states, IP addresses — even when the program printing it doesn't color anything itself. Here's what it's for and how t

A lot of the things you run over SSH don't bother coloring their own output — a `systemctl status` line, a build log, a homegrown deploy script all tend to print plain text even when it's obviously good news or bad news. **Output Highlighting** fixes that: Tempest colors matching text as it appears on screen, based on rules you control, so the important parts jump out even when the program itself didn't bother. If you've used MobaXterm's output coloring, this is the same idea.

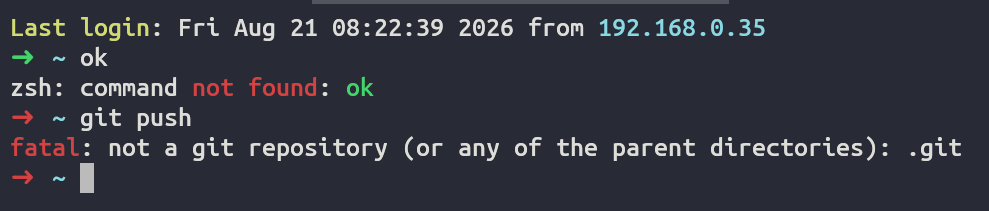
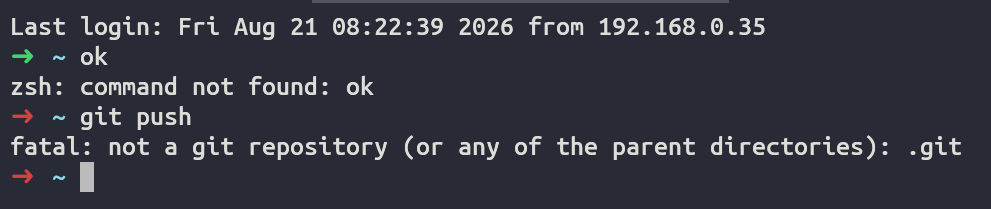
Same session, before and after:

<figure><img src="https://3410580572-files.gitbook.io/~/files/v0/b/gitbook-x-prod.appspot.com/o/spaces%2FVJ43ZDtCrZnz5xabHcML%2Fuploads%2Fgit-blob-6199d42b2c39a6f9060db58384ec138972c2941d%2Foutput-highlighting-disabled.png?alt=media" alt=""><figcaption><p>Off — a login banner, an IP address, and a fatal error, all in the same plain white</p></figcaption></figure>

<figure><img src="https://3410580572-files.gitbook.io/~/files/v0/b/gitbook-x-prod.appspot.com/o/spaces%2FVJ43ZDtCrZnz5xabHcML%2Fuploads%2Fgit-blob-477a57eaf2cde0f84b4bbc1426f524157f90bc1e%2Foutput-highlighting-enabled.png?alt=media" alt=""><figcaption><p>On — the login banner is flagged, the IP address stands out, and the error is impossible to miss</p></figcaption></figure>

## How to turn it on

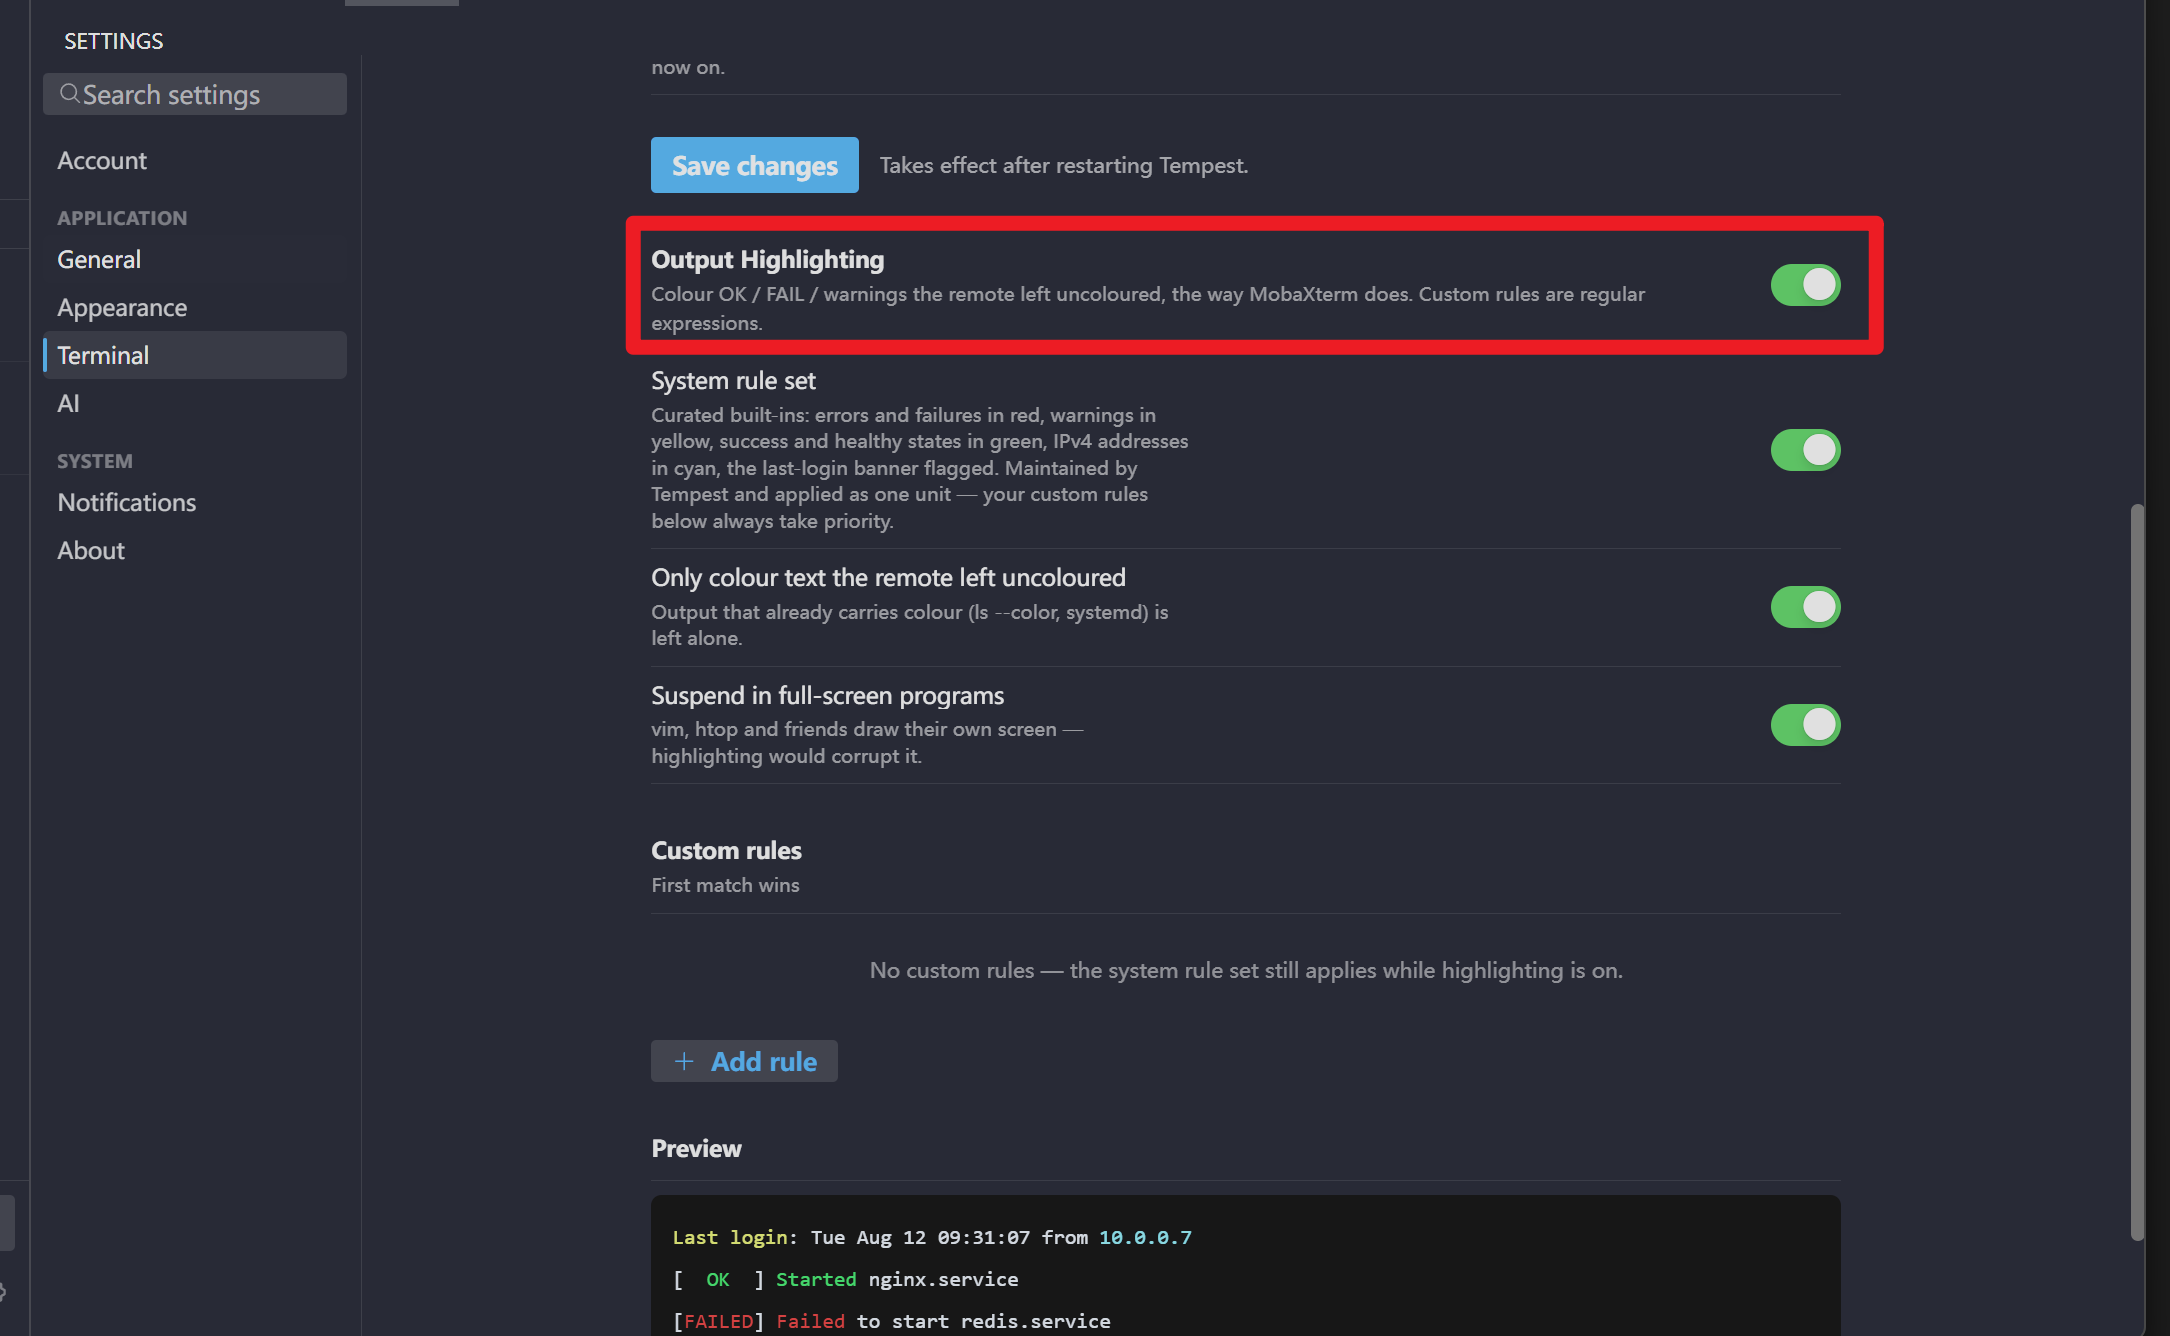
Go to **Settings → Terminal → Output Highlight** and flip it on. A set of sensible defaults is active immediately — you don't need to write anything yourself to get value from it. Changes here take effect after restarting Tempest.

<figure><img src="https://3410580572-files.gitbook.io/~/files/v0/b/gitbook-x-prod.appspot.com/o/spaces%2FVJ43ZDtCrZnz5xabHcML%2Fuploads%2Fgit-blob-69efb5618a05793ee82bda8dddb403d8ee8338d8%2Foutput-highlighting-settings.png?alt=media" alt=""><figcaption><p>Settings → Terminal — the main toggle, the built-in rule set, and the two behavior switches</p></figcaption></figure>

This is a **Pro** feature.

## What gets highlighted by default

* Failure/error text (`ERROR`, `FAIL`, `denied`, `timeout`, …) → **red**
* Warnings (`WARN`, `DEPRECATED`, `RETRY`, …) → **yellow**
* Success and healthy states (`OK`, `SUCCESS`, `running`, `active`, `connected`, …) → **green**
* Failed-login banners → **yellow**
* IP addresses → **cyan**

## Adding your own rules

If you want to highlight something specific to your own systems — a hostname, a job name, a status code your app prints — add a custom rule in the same settings screen. For each one you pick:

* A pattern to match (supports regex if you want something more precise than a plain word)
* A color, from a set that stays legible in both light and dark themes
* Whether to color just the matched word or the entire line it's on

Rules can be reordered, turned on or off individually, and there's a live preview so you can see the effect on sample text before you commit to it — no need to go find a real server to test against.

Two extra toggles are worth knowing about:

* **Only apply to plain output** — so highlighting never fights with a tool that already colors its own output
* **Pause inside full-screen apps** — so it automatically gets out of the way while you're in `vim`, `htop`, or anything similar that takes over the screen

## Not the same as searching

This is different from the terminal's **Find** feature. Output Highlighting keeps things visually flagged all the time as you scroll, without you doing anything — good for "always show me anything that looks like a failure." Find is for actively jumping between occurrences of a specific term you're looking for right now. Clickable links (like URLs you can open with a click) are a separate feature too. Use whichever matches what you're actually trying to do in the moment.

## See also

* [Tempest Monitoring](/productivity/tempest-monitoring.md) — pair highlighting with live gauges for at-a-glance server health
* [Split Screens](/productivity/split-screens.md) — highlighting works the same way across tiled panes
* [SSH Snippets & Scheduled Commands](/productivity/snippets-scheduled-runs.md) — combine with saved commands whose output you want to scan quickly